How to Add or Remove, Hide & Save Indicators in TradingView?
Technical Indicators are the most important tool that you can apply in the TradingView chart to analyse the stock price movement and sentiments of the traders or investors towards the market. You can add various types of indicators on candlestick charts and at the bottom of the TradingView chart with the options to customize and adjust the parameters.
Also Read:
Once you have set up the TradingView chart, you can choose from the top best indicators in TradingView as per your trading strategy and investment time horizon. In TradingView you can add, remove or hide the technical indicators anytime with the option to apply multiple indicators or merge the indicators as per your intraday or long-term analysis needs.
Also Read: Top 5 Best Technical Indicators for Intraday or Day Trading
Similarly, there are various options in TradingView you can use while applying the technical indicators. From price-based indicators to volume indicators, you can find the different types of indictors to analyse the various technical factors to trading. Hence, we brought here the guidance to know how to add, remove or hide the indicators in the TradingView.
How to Add Indicators in TradingView?
To add the Indicator in TradingView first you have to choose the script or market index showing the price movement through the chart. You can search the symbol and select the same to plot the chart with the selected period. And in TradingView by default, the volume bar charts are also visible at the bottom. Once the chart of any stock, financial instrument or market index is visible there, you can apply the technical indicators by following the steps given below.
Also Read:
Steps to Add Indicator in TradingView:
Step 1: First of all click on the “Indicators” option showing on the top left side.
Step 2: A popup window will be open showing the Indicators, Metrics & strategies.

Step 3: Now in the search box you can type the name of the indicator you are looking to apply.
Step 4: You can see the list of all indicators with the similar name you typed.

Step 5: Now select or click on the indicator you are looking to apply.
Step 6: When click on the selected indicator it will be applied to the chart.
Step 7: Now close the popup window showing the list of indicators and see the chart.

Step 8: Here you can see the selected indicator is showing on the chart with default parameters.
Step 9: To change the parameters and other settings click on the indicator settings icon.
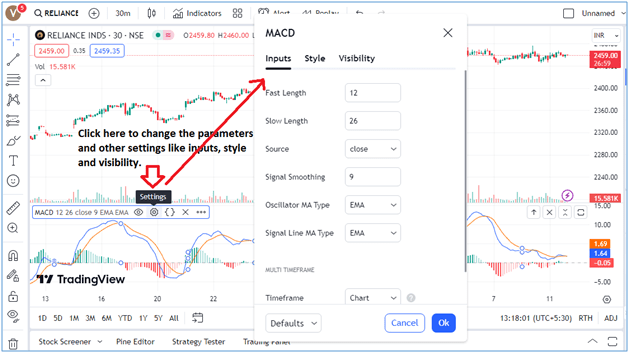
Step 10: A popup window will open and you can change the inputs, style and visibility.
The selected technical indicator will show the trend or indicate the price movement as per the parameters selected. You can fully customize the indicator by choosing different colours for the indicator line and selecting the same for different period ranges. From here you can also save the chart and indicator settings as default or reset the same with one click.
Also Read: How to Find Trending Stocks for Intraday Trading: Ten Rules
How to Remove Indicators on TradingView?
Just like adding the technical indicators in the TradingView you can easily remove the same from the chart. Just follow the steps given below.
Steps to Remove Indicators on TradingView:
Step 1: Move your mouse cursor on the indicator panel to highlight the menu options.

Step 2: Now click on the cross icon (X) to remove this current indicator from the chart.
Step 3: If you right-click on a highlighted menu, also can see the option to remove the same.
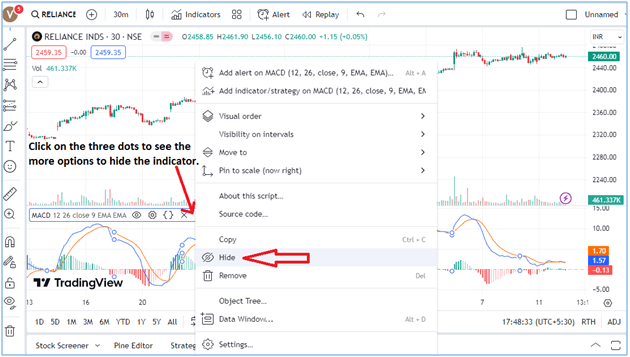
Step 4: You can also select the delete icon on the bottom left-hand side to remove the indicator.

Step 5: Just right-click on the chart and you will see the option to remove the indicator.

Hence there are three ways by which you can remove the indicators from the TradingView chart. However, if are following the first two steps you will remove only the selected indicator, while if you use the third and fourth steps, then all the indicators applied on the TradingView chart will be removed. Hence, make sure which indicator you want to remove, select only that one manually otherwise all the indicators will be removed from the TradingView.
How to Hide or Unhide Indicators in TradingView?
However, if you don't want to remove the indicator and just need to hide the same for a while, you can do it with the one click option discussed below.
Steps to Hide & Unhide Indicators in TradingView:
Step 1: Move the mouse cursor on the indicators menu option to see the short-cut icons.
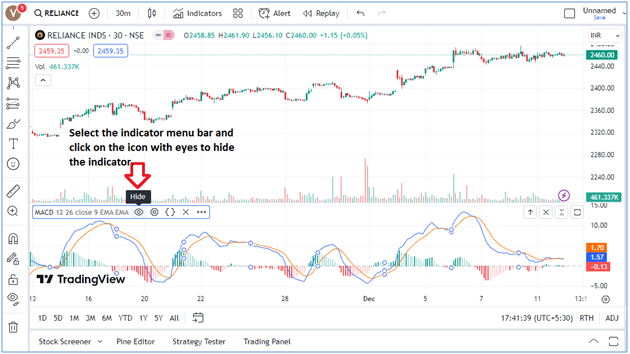
Step 2: Now just click on the icon with eyes and the indicator will be hidden on the chart.
Step 3: You can also select the three dots option and can see the option to hide.

Step 4: To unhide just click on the eyes icon and the indicator will be visible again.
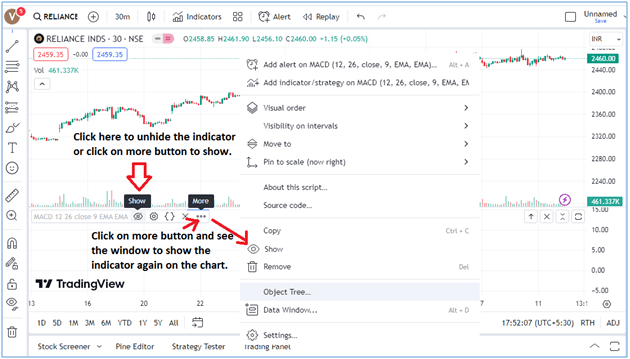
Step 5: Click on the “More” button to see the option in the window to show the indicator.
These are the simple steps to hide and unhide the indicators in the TradingView. However, when you hide the indicator, the technical indicator will be not visible on the chart but you can see the indicator menu with the show icon highlighted to unhide at one click. Other options on the indicator menu are also clearly visible like settings, source code, remove button and three dots to see the various options like create alert, change the visual order etc.
How to Merge or Combine Indicators in TradingView?
In the TradingView chart, it is not necessary to apply one indicator at a time, instead, you can plot the multiple indicators on the same chart. Even after plotting the two different indicators, you can merge both of them on the same panel. This gives the flexible options to combine the different indicators in TradingView to analyse the price movement.
Steps to Combine or Merge 2 Indicators in TradingView:
Step 1: First of all search and add another indicator on the same TradingView chart.
Step 2: Now select the indicator context menu three dotted more options to see the window.

Step 3: A popup window opens, navigate to the "Move to"option and select the “Existing Pane Below”.

Step 4: Now you can see both the indicators are merged with each other on the same pane.

Step 5: Or you can also drag the above indicator below to merge with each other manually.

Step 6: You can also move the indicators up and down by clicking the icons given on the right side.

Apart from merging or combining the two indicators in TradingView you can add or apply an indicator or strategy not only to price data but to another indicator as well. And to do that highlight the existing indicator like MACD and click on the more button.
A popup window will be opened and click on the option “Add indicator/strategy on MACD, and you can see the chart below the RSI indicator is added on for the MACD indicator in another pane.
Also Read:
How to Lock or Unlock Indicators on TradingView?
You can plot the indicator on TradingView with various options to customize, hide or unhide and combine different indicators. However, if you are looking to freeze or lock any indicator that has been applied on the chart, then there are no specific options to do that. But there is one option on the left-hand side panel you can use to lock the chart.

On the left-hand side, you can see the drawing tool panel, where at the bottom move your mouse cursor to the "Lock" icon, the drawing tool on the entire chart panel will freeze or lock. However, you can add, edit, modify and customize the indicator menu and its settings, as there are no specific options to lock that. And to unlock the same just click on the same lock icon given on the bottom left-hand side and all the drawing tools will be unlocked again.
How to Save Indicators in TradingView?
If you don't have the option to lock only the indicator in the TradingView chart, you can save the indicators in TradingView through the indicators templates option given on the chart panel. To know how to save the indicators templates follow the steps given below.
Steps to Save the Indicators in TradingView:
Step 1: First of all open the TradingView with a selected symbol on the chart.
Step 2: Now search and add any desired technical indicator you are looking to save.
Step 3: Now Click on the "Indicator Templates" button given on the top left of the chart window that is visible next to the indicators option.

Step 4: Click on the first option - “Save indicator template”.
Step 5: Now a popup window will show and ask you to give the name of the template.

Step 6: Give your template a name and click on the save button to save the same.

While saving the template name you can also save the symbol and time intervals on the chart by clicking on the check boxes given on the same window. And to reload or apply the same indicator on any other chart you can open the indicator templates option and select your saved template. It will be applied to the existing chart with the settings you saved.
How to Edit Indicator in TradingView?
If you have saved any indicator in TradingView you can edit the same with the option given for the users. You have multiple options to edit or customize the technical indicators you have applied on the TradingView chart. Follow the steps below.
Steps to Edit Indicator in TradingView:
Step 1: Move your mouse cursor on the indicator menu context and click on the setting option.
Step 2: Now, you can see an additional popup window to edit the indicator on TradingView.
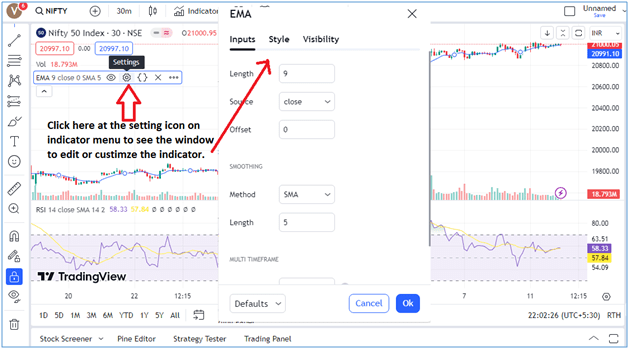
Here you see three sub-menus – inputs, style and visibility to change the parameters of period, timeframe, style of plotting the indicator, and different ranges of time. You can edit or change the settings and save this settings. However, after changing or editing any inputs or other options you can also restore the original settings by clicking the "Reset settings" option given below at the bottom of the popup window you have opened to edit the indicators settings.
Wrapping-Up
You can use the given options and follow the steps given above to add, remove, hide, unhide, save and edit the chart and all the technical indicators in TradingView. Almost all the options are free to use, but you have to register or create an account using a valid email ID. However, still there are multiple options that are not free to use unless get the paid version.
However, applying an indicator on TradingView is not enough to analyse the price movement of stock or market index. Here you also need to understand the chart structure in TradingView like candlestick chart patterns and different trends in the market. When you use the best indicators in TradingView in combination with the right chart patterns, you will analyse the movement and trend in the stock or market index to make the right decisions for trading.
Also Read: How to Identify Trend in Stock Market: 10 Points to Find Trend
Here you can get help from the market experts and have better knowledge and experience in fundamental analysis and technical analysis with access to all the functions or features given on TradingView. You just need to open the trading account and demat account with the broker, to get a trading facility using the TradingVeiw chart backed with market experts.
Also Read: Technical Analysis vs Fundamental Analysis: Which is Better
Moneysukh is right here to help you meet your trading and investing goals with a one-stop solution to trade or invest in equities, commodities and the forex market. It is one the best discount brokers in India offering the best trading platform and applications like Trade Radar, Trade Tron, FoxTrader, AlgoBulls, Keev, Quantman and TradingView at the lowest pricing.
Here you can also trade with the most advanced trading software Algo-trading to enjoy the power of high-frequency trading with the options to start with the best algo trading platform and trading strategies or trade with the best intraday algo trading strategy. At Moneysukh you can choose the to earn extra money from an AI-backed automatic trading system to make your trading and investment journey more profitable.
Also Read: What to Know Before Investing in Stocks: 10 Things to Consider
